Average speed is a bad training metric because it collapses wind, gradient, stops, traffic and pacing into a single number, so it can swing by 10 km/h between two rides where you produced exactly the same effort. It is a good description of a ride. As a measure of fitness or training progress, it tells you almost nothing.
I ride with a lot of club riders who watch one field on their head unit more carefully than any other. It is the average speed field. When it drops, they assume something went wrong with them.
Usually something went wrong with the day. The fix is not working harder on the next ride. It is switching to metrics that separate your effort from the weather and the road.
Table of Contents
- What Does Average Speed Actually Measure?
- Why Average Speed Is a Bad Training Metric
- How Do Hills and Wind Distort the Number?
- How Does a Paceline Change the Result?
- What Training Metrics Are More Useful?
- How Can You Compare Different Rides Fairly?
- How Should You Use Power and Heart Rate?
- How Should You Track Century Training Progress?
- Frequently Asked Questions
- Is average speed useless for tracking fitness?
- What should I track instead of average speed if I do not have a power meter?
- Can I compare my average speed on the same route?
- Why is my average speed lower on group rides?
- Is a faster average speed always better for a century?
- Conclusion
What Does Average Speed Actually Measure?
Average speed is your total distance divided by your total moving time. Moving time excludes anything the computer paused for, so a coffee stop and a mechanical do not count against the number, but everything else does.
One detail trips people up. It is not the arithmetic mean of your speeds. It is a time-weighted mean, so a slow hour at the start counts far more than a fast two minutes at the end. That is why riders who sprint the last few kilometres sometimes see a lower average than riders who cruised the whole way.
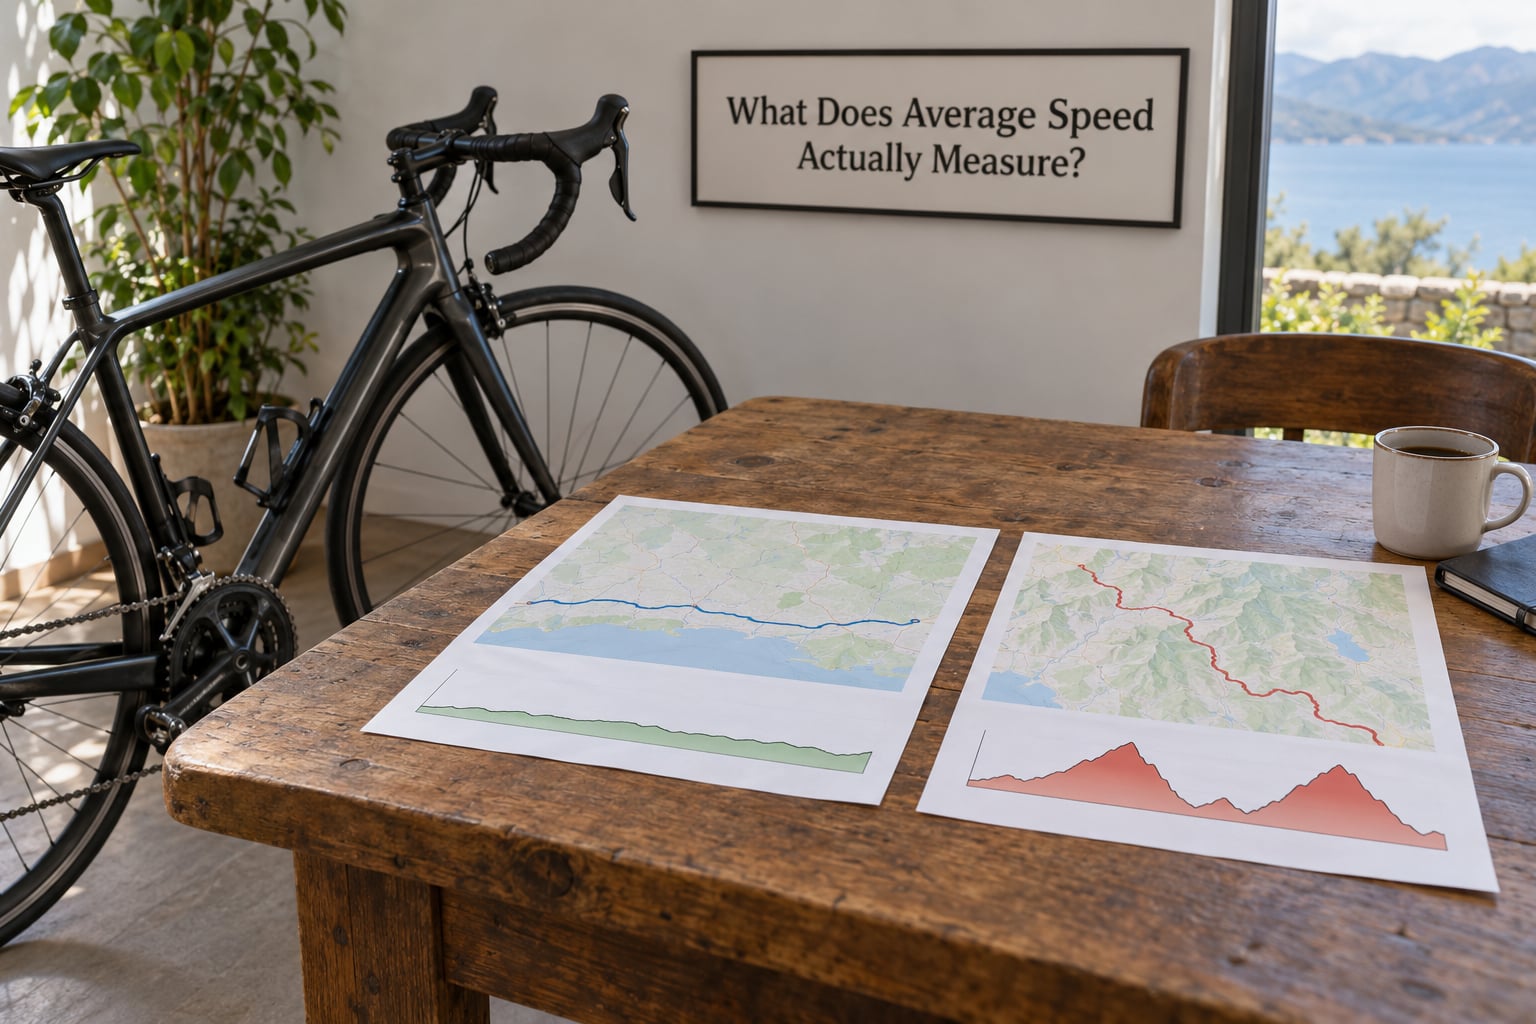
Here is the problem in one table. These two rides both show 26.0 km/h average. The work done is not remotely comparable.
| Ride | Distance | Moving time | Average speed | Elevation gain | Condition |
|---|---|---|---|---|---|
| Saturday club loop | 80 km | 3h 04m | 26.0 km/h | 850 m | Rolling, tailwind on the return leg, two regrouping stops |
| Sunday solo headwind ride | 80 km | 3h 04m | 26.0 km/h | 310 m | Flat road, 30 km/h gusting headwind almost the whole way |
Same distance, same time, same number on the screen. On a power meter those rides land in completely different places, because the second one asks you to hold a much harder effort for the same three hours to arrive at the same figure.
Average speed is a description of the journey. Distance over time tells you where you went and how long it took. It does not tell you what it cost you.
Why Average Speed Is a Bad Training Metric
Because a single variable moves the number without any change in the rider. Here are the confounds worth knowing about, in rough order of how much damage they do.
Wind direction. A tailwind on the outbound leg and a headwind on the way home can produce almost identical average speeds on an out-and-back that was physically twice as hard as a calm-weather loop.
Gradient and elevation profile. A route with 850 m of climbing and the same distance on the flat are not interchangeable, yet they can produce the same average.
Traffic and mechanical delays. Ten minutes of slow group riding through a town changes the average far more than most riders change in a month of training.
Group behaviour. Waiting at a junction, regrouping after a drop, or nursing a rider with a puncture all add moving time at low speed.
Route familiarity. Your first time over a new road is spent braking for junctions and checking turns. Your fifth time is not.
Pacing choices. Riders who conserve early and push late and riders who go hard from the start can finish with near-identical averages having done completely different training.
None of those is a fitness variable. That is the whole argument.
How Do Hills and Wind Distort the Number?
Climbing costs speed and buys nothing in the average column. Eight hundred metres of gain spread over 80 km is roughly one percent of extra gradient on average, which is small. Ten thousand metres over 100 km is a different day entirely.
Wind is the bigger problem, and the physics explains why. Aerodynamic drag rises with roughly the cube of speed relative to the air. Push a running pace from 3 m/s to 4 m/s and the air resistance term grows by about two and a half times. Do the same on a bike at 8 m/s, and the growth is closer to three times.
That is why a 25 km/h headwind feels qualitatively worse on a bicycle than the same number does to a runner. Doubling your airspeed quadruples the power you need just to hold position.
So a rider can drop from 29 to 24 km/h purely from wind, feel like they are dying, and be no less fit than last month. If you judge that ride by the number, you will chase it next week and end up overtraining on a windy day.
How Does a Paceline Change the Result?
On a group ride the average belongs to nobody. Drafting cuts the leader’s air resistance dramatically, so the wheel takes a fraction of the work. Rotating pulls means your contribution depends on when you happened to be on the front.
Add regrouping after every climb, waits for riders to rejoin, and a pace line that stretches when the road tilts, and the group average starts measuring the ride’s logistics rather than any one cyclist’s performance.
This is why two riders on the same ride can have very different normalized power and identical average speeds. One sat in the bunch all day. The other pulled for forty minutes. The screen shows the same figure for both.
What Training Metrics Are More Useful?
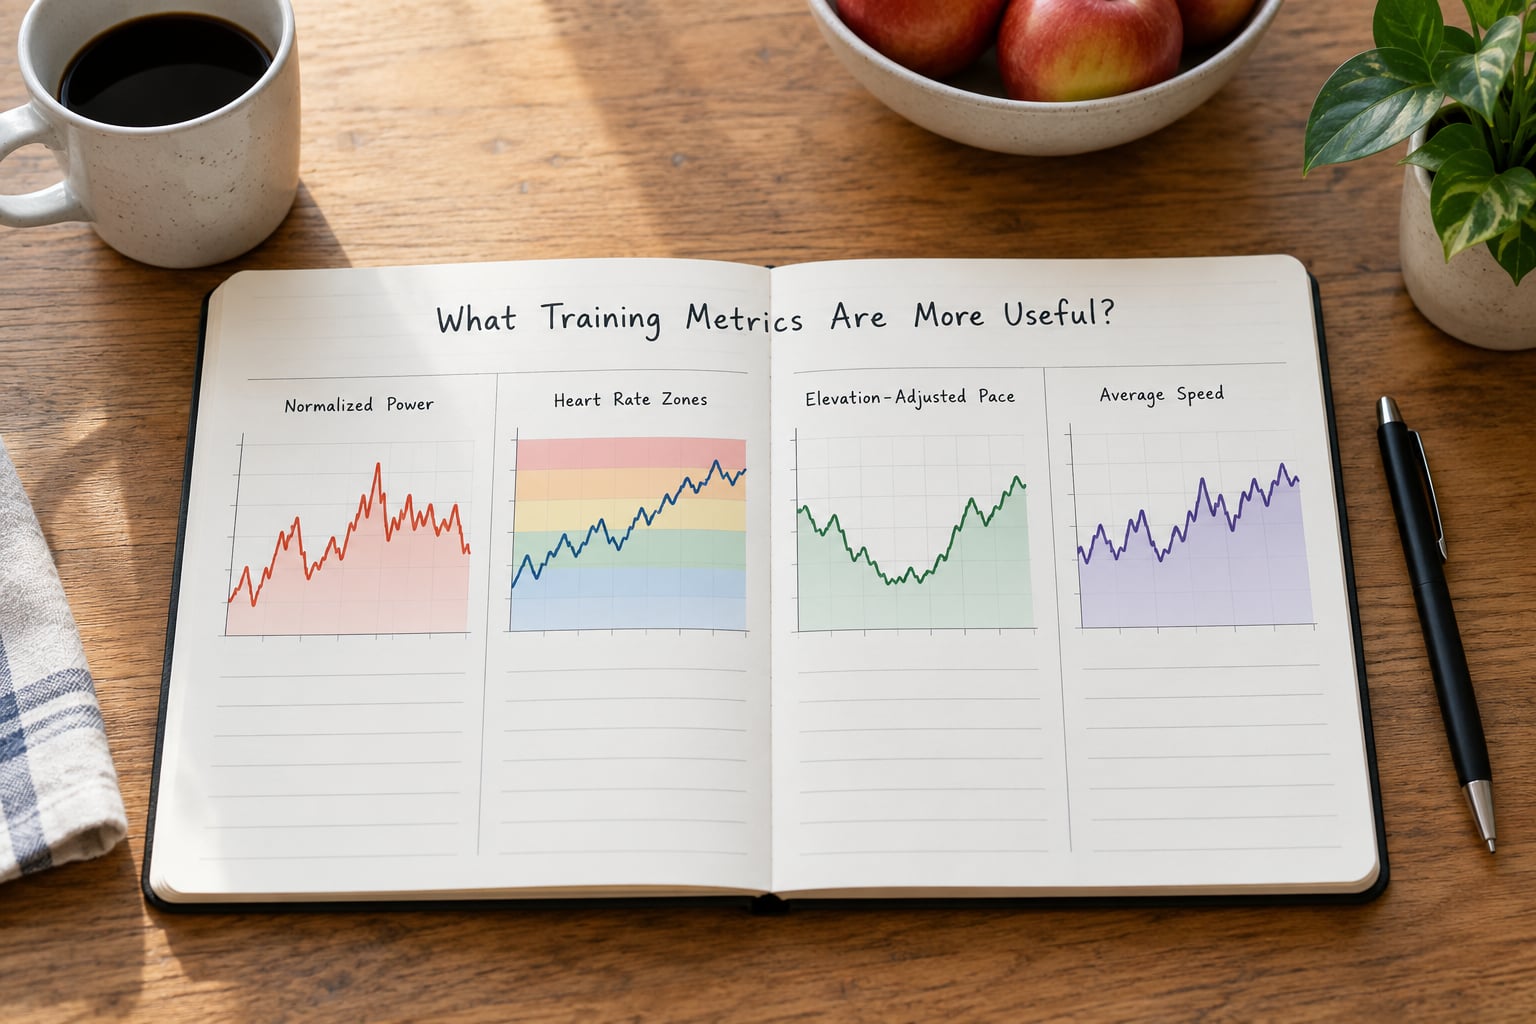
Here is how the common metrics rank, and what each one is bad at.
| Metric | What it measures | Main limitation | Where a club rider uses it |
|---|---|---|---|
| Normalized power | Average power with hard efforts weighted properly, using a rolling 30 second average | Needs a working power meter; ignores wind entirely | Judging whether a session was hard enough |
| Functional threshold power | Highest average power sustainable for about an hour | Test-dependent; drifts with heat and freshness | Setting zone boundaries |
| Watts per kilogram | Power divided by body mass | Useless for comparing riders on different equipment | Fair cross-rider comparison |
| Variability index | Average power divided by normalized power | Only meaningful above about an hour | Showing whether a ride was steady or surgey |
| Grade-adjusted pace | Speed corrected for gradient | Corrects gradient, not weather | Comparing the same route in different seasons |
| Heart rate | Response to effort, lagged and affected by heat and stress | Drifts with caffeine, heat, fatigue and nerves | Long steady endurance efforts |
| Cadence | Pedalling rhythm | Says nothing about power or fitness | Spotting a gear that is grinding you down |
| Average speed | Distance over moving time | Changes with weather, road and group for free | Describing the ride afterwards |
One definition each, since these get mangled constantly. Normalized power is a rolling 30-second average of your power readings, raised to the fourth power and averaged, then square-rooted, so that a hard block is neither hidden nor over-rewarded. Functional threshold power is the highest average power you can hold for around an hour. Watts per kilogram is power divided by body mass.
Pick one primary and one supporting metric. More than that and you are scrolling, not training.
How Can You Compare Different Rides Fairly?
Comparing a windy flat ride to a rolling weekend loop is not evidence of anything. Before you conclude anything from a ride, match these six things.
- Route. Same roads, or at least the same gradient profile. Grade-adjusted pace is the closest shortcut when they differ.
- Wind. Check the direction against the route before you set out. If you rode last week into a tailwind and this week into a headwind, you have no comparison.
- Weather. Temperature changes your power and your heart rate for the same watts.
- Equipment. Fresh tyres, higher pressure and a clean chain are worth more than most riders expect.
- Your role. Sitting in the bunch, leading the pace and riding solo are three different efforts wearing the same number.
- Purpose. A recovery spin and a three-hour endurance ride should not produce similar figures, and if they do, one of them was mistimed.
Then look at the shape of the ride rather than the summary line. Did the power hold steady, or did it fade in the last hour? That is the information worth carrying into next week.
How Should You Use Power and Heart Rate?
Two tools, two jobs. Power tells you how hard you are working right now. Heart rate tells you how that effort is landing over the long term.
For a tempo ride, power is the better guide because heart rate lags badly on short efforts. Sit near the middle of your zone for twenty minutes, hold it, and finish with a number you can repeat next week. Round numbers work well: 200 W for a rider whose threshold sits near 250 W.
For a century, heart rate earns its place. Power drifts as you tire and as the wind builds, but heart rate stays honest about whether you are coping. Settle into your endurance zone early rather than letting power pull you over it, and let heart rate tell you when you are drifting too low to call the day a success.
For recovery, the honest test is not the number. It is whether your heart rate came back to resting within about an hour of finishing, and whether the next morning felt normal. A recovery ride that logs an impressive average and leaves you flat for two days was not a recovery ride.
Keep heart rate out of interval sessions and short climbs. It takes time to respond, so it will always under-report the spike and over-report the recovery.
How Should You Track Century Training Progress?
A century is long enough that it rewards durability over speed. That makes it the opposite of a ride best judged by average speed.
Rolling power. Your average over 20 to 60 minutes across a season tells you far more than any single long ride. If it is climbing across May and June, you are progressing.
Fatigue resistance. Split any long ride into thirds and compare the power in each. Holding 85 percent of your opening power into hour three is a genuinely trainable quality, and it shows up nowhere in average speed.
Consistency. Look at your weekly load trend rather than any single day. A steady ramp with recovery weeks built in beats one heroic Saturday.
Fueling execution. Practice eating 60 to 90 grams of carbohydrate per hour on training days. A century that goes wrong at kilometre 140 is usually a fuelling problem, not a fitness one.
Back-to-back performance. Ride a long route, then repeat it a week later. If the second ride holds the same power at the same heart rate, that is the clearest progress signal available to a club rider.
Frequently Asked Questions
Is average speed useless for tracking fitness?
Not useless, just badly suited on its own. It works as a self-comparison on one repeated route in similar conditions, which is why experienced riders keep ride logs. It fails the moment the route, wind or group changes. Use it to describe the ride, and use power, heart rate or grade-adjusted pace to judge the effort.
What should I track instead of average speed if I do not have a power meter?
Three numbers cover most of it. Grade-adjusted pace from your existing computer removes the gradient distortion. Heart rate zones from a chest strap capture sustained effort. A self-rated rate of perceived exertion after the ride catches the days your heart rate lagged behind. Those three replace most of what average speed was doing badly.
Can I compare my average speed on the same route?
Yes, and it is the one case where the number carries real information. Repeat the same roads, in the same part of the season, ideally at a similar time of day, and check wind direction before you go. If the wind is against you on both efforts, an improvement of a few tenths is genuinely meaningful over a season.
Why is my average speed lower on group rides?
Usually traffic, regrouping and pace changes rather than fitness. A club ride stops for junctions, waits for stragglers after climbs, and often sits at a conversational pace on the flat. You also spend most of the ride in the bunch drafting, which means your own effort was hard while the group’s average looked slow. Check normalized power next time before assuming you got weaker.
Is a faster average speed always better for a century?
No. A century rewards riders who hold a steady pace and still have something left at 140 km, not riders who go out hard and survive on adrenaline. Going too fast early raises your heart rate above your sustainable zone, burns glycogen faster than you can replace it, and usually produces a slower finish. Power and heart rate in the last hour tell you far more than the average line.
Conclusion
Stop scoring every ride by one number that the wind, the road and your friends are also editing.
Do this on your next ride: pull up your last ten entries, sort by average speed, then sort by elevation gain and check the wind on each day. The pattern usually explains itself within five minutes. Then move your primary metric to normalized power, heart rate zones or grade-adjusted pace and leave average speed where it belongs, in the description at the bottom of the file.