Normalized power is a single number that describes how hard a ride really was, not just how many watts you produced on average. It estimates the steady power you could have held for the entire ride to produce the same physiological cost as what you actually did. That is the answer to what is normalized power, and it matters because average power treats a calm hour at 200 watts and an hour of 30-second surges as identical.
I have watched club riders burn themselves out for years, guessing at effort. The moment a power meter shows you that your hilly group ride and your time trial were nowhere near equivalent, the guessing stops. Below is how the metric is built, what the number tells you, and where it falls apart.
Table of Contents
- What Is Normalized Power, Exactly?
- Key takeaways about normalized power
- Why the fourth power?
- How Is Normalized Power Calculated?
- A worked example
- What Does Normalized Power Tell You About a Ride?
- Average power vs normalized power vs Variability Index
- What a Variability Index number means
- What Is Intensity Factor?
- How Do You Use Normalized Power in Training?
- What normalized power looks like across ride types
- Where to find normalized power on your device
- Reading normalized power on a long ride
- What Are the Limitations of Normalized Power?
- Frequently Asked Questions
- What is the difference between average power and normalized power?
- Is normalized power the same as FTP?
- How do you calculate normalised power?
- What does normalized power mean in Garmin?
- Can I trust normalized power for short efforts under 10 minutes?
- Why is my normalized power higher than my average power?
- Conclusion
What Is Normalized Power, Exactly?
Normalized power, usually abbreviated NP, is an estimate of the steady power you could have held for the whole duration of a ride to produce the same physiological cost as the ride you actually completed. In plain terms, it is your ride rewritten as one continuous effort at one constant power.
The metric was developed by TrainingPeaks in the early 2000s and later appeared in Training Stress Score and Intensity Factor, which is why nearly every major platform now computes it, from Garmin to Wahoo to Strava. Most riders meet it as a field on a ride summary, often with a percentage next to it, and take it at face value. It is worth understanding the shape of the number before you do.
Key takeaways about normalized power
- It is always equal to or higher than your average power, because the fourth power weighting punishes the big efforts.
- It never tells you how hard a ride actually felt, only how hard it looked in the power file.
- It is meaningless under about 20 minutes, and unreliable under 10 minutes.
- Two rides with identical average power can have very different normalized power, and that gap is the useful part.
Why the fourth power?
Here is the intuition most explanations skip. A thirty-second sprint at 900 watts is not a scaled-down version of a thirty-second effort at 200 watts. The high effort costs you disproportionately more, and you pay for it long after it ends.
So the calculation weights every sample by the fourth power of its value. Doubling power multiplies its weight by sixteen. That single choice is what pushes surges to the surface instead of letting them hide inside an average.
How Is Normalized Power Calculated?
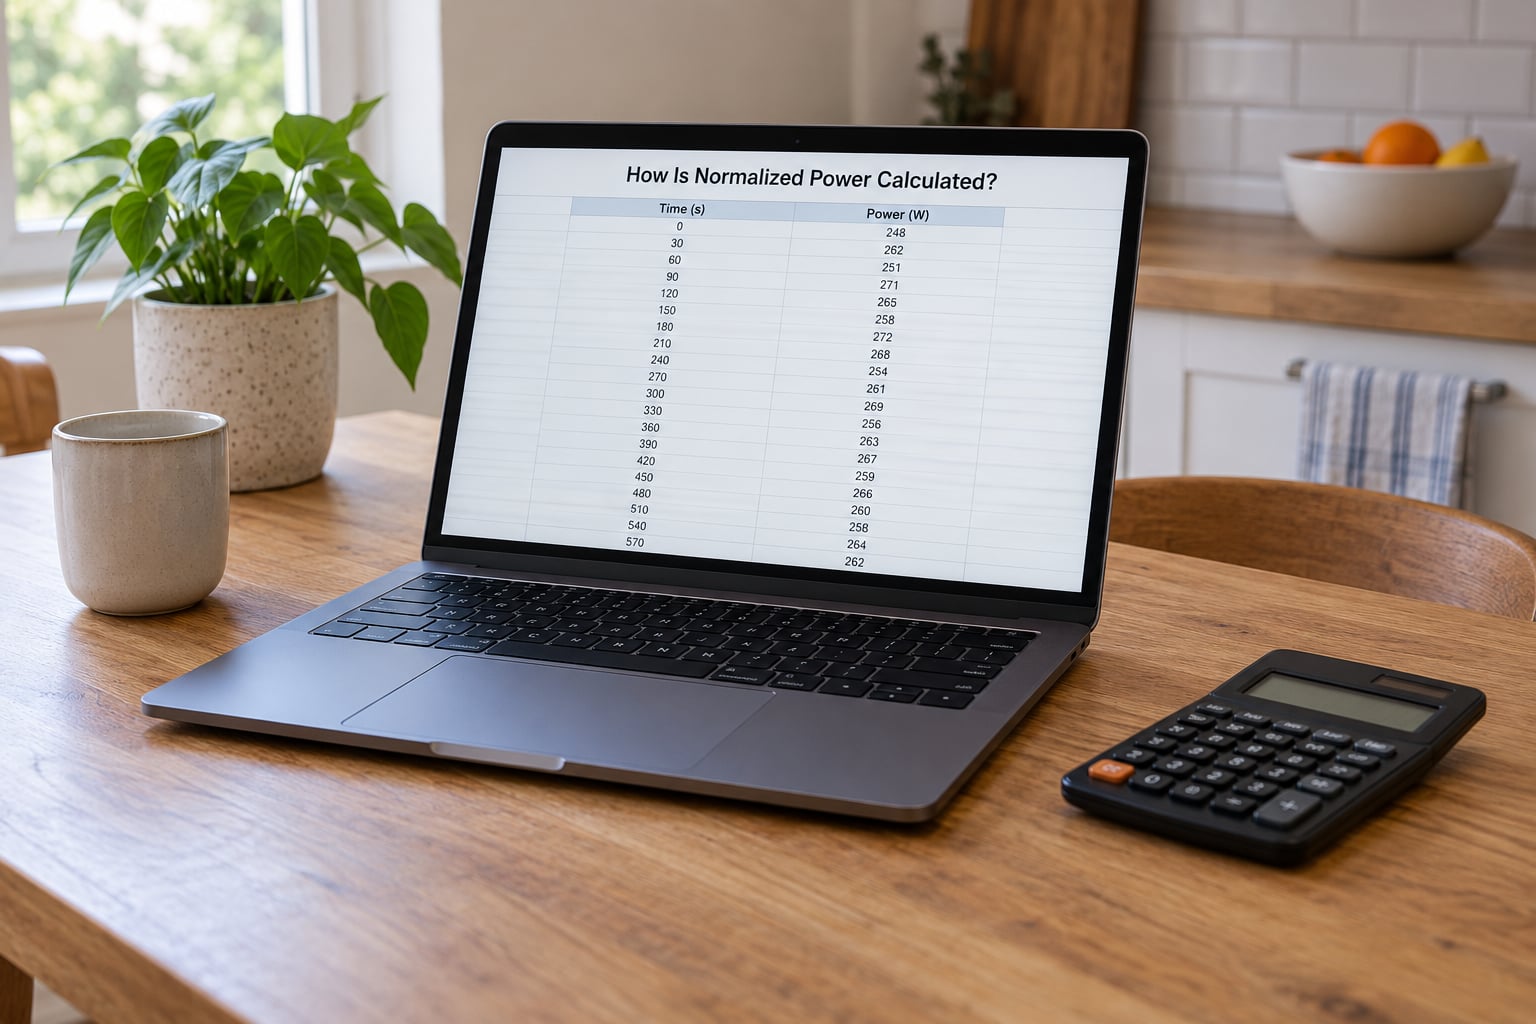
The calculation takes four steps, and every platform on the market does it this way. The British spelling, normalised power, shows up in older coaching material and UK forums, but it is the same number.
- Average the raw data. Your power meter samples roughly once per second. Smooth that stream into a 30-second rolling average so the calculation ignores sensor noise and pedal spikes.
- Raise every value to the fourth power. This is the weighting step, and it is where the surges come back.
- Average those raised values. You now have one large number representing the whole ride.
- Take the fourth root. Root it back down to watts, and you have your normalized power for the ride.
Note the 30-second rolling average only smooths out things that happen faster than 30 seconds. A two-minute surge survives intact, which is exactly why NP responds to the surges that matter in racing.
A worked example
Here are two five-minute efforts, both with an average power of 220 watts. The variable one is a mess of surges and recoveries; the steady one never changes.
| Sample (30-second rolling average) | Steady effort | Variable effort |
|---|---|---|
| 1 | 220 W | 300 W |
| 2 | 220 W | 300 W |
| 3 | 220 W | 140 W |
| 4 | 220 W | 140 W |
| 5 | 220 W | 300 W |
| 6 | 220 W | 300 W |
| 7 | 220 W | 140 W |
| 8 | 220 W | 140 W |
| 9 | 220 W | 300 W |
| 10 | 220 W | 140 W |
The steady ride comes out at 220 watts, because the fourth power of the same number is still the same number, and the average is unchanged. The variable ride is a different story.
Raise each value to the fourth power. 300 to the fourth is 8.1 billion; 140 to the fourth is 384 million. Five of each gives a total of 42.4 billion, and an average of 4.24 billion. Take the fourth root of that and you land at roughly 255 watts.
Same average power, 220 watts. Different normalized power, about 35 watts apart. That gap is the whole reason the metric exists.
What Does Normalized Power Tell You About a Ride?
Normalized power sits between your average power and your max power, and it answers a different question from each of them. Average power describes the arithmetic of the ride. Max power describes your best moment, which on a six-hour ride might last four seconds. Normalized power describes the cost of the whole thing.
It is also a fair comparison tool. A rider who holds 240 watts for an hour and a rider who averages 240 watts over a hilly, surging loop have done very different physiological work, and NP exposes that without anyone having to argue about it.
Average power vs normalized power vs Variability Index
| Metric | What it measures | Formula | Higher or lower |
|---|---|---|---|
| Average power | The plain arithmetic mean of every sample | Sum of samples divided by time | Either. It is just a description. |
| Normalized power | Steady power matching the same physiological cost | Fourth root of the mean of each 30-second average raised to the fourth power | Higher means more variable and more costly. |
| Variability Index | How much of the ride was surge and recovery | NP divided by average power | Higher means less steady, and usually harder to hold. |
| Max power | Your single highest reading | Highest value in the file | Higher means more sprint ability, nothing more. |
| Time in zones | How long you spent in each band | Minutes per zone | Depends entirely on the zone model. |
Variability Index is the number riders usually find after they get bored of NP alone, because it scales the comparison to any ride. If a 90-minute ride has a VI of 1.16 and a four-hour ride has a VI of 1.16, both were equally unsettled in the same way.
What a Variability Index number means
| VI | What the ride looked like | Typical example |
|---|---|---|
| 1.00 to 1.05 | Almost perfectly steady | Ramp test, 20-minute test, structured indoor workout |
| 1.05 to 1.15 | Mildly unsettled | Endurance spin with a few accelerations |
| 1.15 to 1.25 | Moderately variable | Hilly group ride, gran fondo with rollers |
| 1.25 to 1.50 | Highly variable | Criterium, cyclocross race, fast group ride |
| 1.50 and above | Chaotic | Mountain bike racing, Zwift crit, surge intervals |
One thing worth knowing: on long rides, coasting drags average power down without dragging normalized power down nearly as much, because zero contributes nothing to the fourth power. If your average collapses and your NP barely moves, you spent a lot of the ride freewheeling. That is not a fault in your riding. It is just what the data says.
What Is Intensity Factor?
Intensity factor is normalized power divided by your Functional Threshold Power, written as IF. Where NP is the cost of one ride, IF tells you how that ride compares to your own ceiling, and a value of 1.00 means you held your FTP for the whole session.
| IF | What it usually means |
|---|---|
| 0.50 to 0.65 | Recovery spin |
| 0.66 to 0.75 | Easy endurance riding |
| 0.76 to 0.85 | Tempo or steady zone 3 |
| 0.86 to 0.95 | Threshold work, zone 4 |
| 0.96 to 1.05 | VO2max intervals and short openers |
| 1.00 | Exactly your FTP for the full duration |
Training Stress Score builds on both. The formula is TSS = (seconds x NP x IF) / (FTP x 3600) x 100, which means a ride’s score scales with how long it lasted, how hard it was, and how hard it was relative to your own threshold.
Using the variable effort from earlier: five minutes at an NP of 255 watts, with an FTP of 300 watts, gives an IF of 0.85 and a TSS of about 72. A one-hour steady effort at 220 watts with the same FTP scores 53. Five minutes of that hard, unsettled work costs more than an hour of smooth riding, which is precisely the relationship the formula was built to capture.
Which raises the question riders ask most: is normalized power the same as FTP? No. FTP is a number you set, and it only changes when you re-test. Normalized power is an output, calculated fresh for every ride, and it happens to equal FTP only when you ride at exactly FTP for the entire duration.
There is a useful re-test trigger hiding in that relationship. If several rides in a row show an IF near or above 1.0 and each one felt comfortably manageable, your FTP number is probably stale. It costs nothing to raise it, and it makes every other number on the platform more honest.
How Do You Use Normalized Power in Training?
On its own, NP is an interesting number. Paired with duration, variability and your own perceived effort, it becomes the clearest way to judge whether a session did what you wanted it to do.
What normalized power looks like across ride types
| Ride type | Typical IF | Typical VI | What NP is telling you |
|---|---|---|---|
| Recovery spin | 0.45 to 0.60 | 1.00 to 1.10 | Almost nothing, which is the point |
| Endurance group ride | 0.60 to 0.75 | 1.10 to 1.30 | Time in the saddle at low cost |
| Tempo or threshold ride | 0.80 to 0.95 | 1.00 to 1.05 | Controlled work, and how much you got away with |
| Criterium | 0.95 to 1.15 | 1.30 to 1.60 | Chaos, and it cost you more than the average shows |
| Gran fondo or century | 0.65 to 0.80 | 1.10 to 1.25 | Rolling terrain doing more work than it looks |
| Five to six hour ultra | 0.55 to 0.70 | 1.05 to 1.20 | Fatigue, not intensity, is the limit |
| Indoor interval session | 0.85 to 1.20 | 1.20 to 1.70 | Structured work you designed yourself |
Use those ranges as a sanity check, not a scorecard. Your numbers on a familiar flat loop will not match a mountain course, and that is expected.
Where to find normalized power on your device
- On a Garmin watch or cycling computer: open the activity from the Connect app or the device’s post-ride summary, and look for the Normalized Power field on the main data page. If it is not shown, add it in the activity’s data page settings or in Connect’s activity fields menu.
- In the Wahoo app or on a Wahoo Kickr: open the ride, tap the summary screen, and look for NP alongside average power and TSS. The Kickr’s ride summary shows it without any setup.
- On Strava: open the ride’s Analysis tab, where the main power graph sits, and look for normalized power and intensity factor in the data shown alongside the graph. Strava computes both from the uploaded power stream.
If the same ride shows different NP values on two platforms, that is normal and worth understanding before you chase it. Each company smooths and samples the file slightly differently, and Strava may also be working from a corrected or power-weighted version of the data.
Reading normalized power on a long ride
On a five or six hour ride, average power usually drops into the 140 to 180 watt range for most riders, and that low number says very little about how hard the day was.
Normalized power is more useful there, and the thing to watch is whether it stays stable from hour to hour or quietly slides downward. A ride where NP holds flat but average power drops is a ride spent coasting, which is usually smart. A ride where NP also falls in the final ninety minutes is a durability problem, and it is visible in the data before you feel it.
Keeping VI low on a long ride is a legitimate goal, not a compromise. Most riders can sit somewhere between 1.05 and 1.15 for six hours and finish with something left.
What Are the Limitations of Normalized Power?
It is a model, not a measurement of your physiology, and it is worth knowing where the model strains.
Short efforts. Below about 20 minutes, NP is not a meaningful number, and below 10 minutes it is close to meaningless. The 30-second rolling average cannot smooth out a five-minute effort, so NP ends up describing something no human could hold. For a bout that short, look at average and peak power for that interval instead. This is also why Training Stress Score under-reports very short, very hard work.
Power meter error. A meter that reads a few percent high pushes everything up with it, including your FTP setting and therefore your IF. The fourth power amplifies the effect at the top of the range, so an inflated reading during a surge is penalised harder than the same error at cruising power. Single-sided and dual-sided pedal meters, crank-based meters and trainer wattage all disagree with each other by a small percentage, and that difference runs straight into your NP.
Fitness drift. If your FTP is stale, every IF and TSS you have ever recorded is distorted with it, usually understated.
It ignores everything watts cannot see. A headwind, a wet road, a long day without enough food and three weeks of accumulated fatigue all change the cost of a ride without changing the power. Cross-check the number against heart rate and against how the ride actually felt, and treat a large disagreement as information rather than an error.
It is not a perfect cross-platform standard. Normalized Power and Training Stress Score are registered marks of TrainingPeaks, and implementations of the calculation are not identical everywhere. Small differences of a watt or two between devices are normal and not worth losing sleep over. Large differences mean a different file, not a broken formula.
Frequently Asked Questions
What is the difference between average power and normalized power?
Average power is the plain mean of every power sample on the ride. Normalized power raises each 30-second rolling average to the fourth power before averaging and then takes the fourth root, which weights hard efforts far more heavily. Because every value stays the same or rises under that process, normalized power is always equal to or higher than average power. On a steady effort the two are identical.
Is normalized power the same as FTP?
No. Functional Threshold Power is a fixed personal number you set through testing and only change when you re-test. Normalized power is recalculated for every ride and estimates the steady power matching the same physiological cost. The two numbers coincide only when you ride at exactly FTP for the entire duration, which is an intensity factor of 1.00.
How do you calculate normalised power?
Take a 30-second rolling average of your power data, raise each of those values to the fourth power, average the results, and take the fourth root of that average. The fourth power is the part riders ask about most, and it exists because short, hard efforts cost far more than their duration suggests. The result is the steady power you could have held for the whole ride.
What does normalized power mean in Garmin?
On a Garmin watch or cycling computer it is the same metric described above, computed by Garmin from your power stream. Open the activity in the Connect app or on the device summary screen and look for the Normalized Power field on the main data page. If the field is missing, add it through the activity’s data page settings. Expect small differences from other platforms.
Can I trust normalized power for short efforts under 10 minutes?
Not really. The 30-second rolling average only smooths out things that happen faster than 30 seconds, so a five-minute effort passes through almost untouched and normalized power ends up describing a power no one could sustain. For bouts under about 10 minutes, look at average and peak power for the interval. For anything over 20 minutes, the number is worth trusting.
Why is my normalized power higher than my average power?
Because surges pull it up. Every value is raised to the fourth power before averaging, and doubling a power multiplies its weight by sixteen, so a short effort at double your cruising power carries extraordinary influence on the final result. Coasting pulls in the opposite direction but far less strongly, since zero contributes nothing to the fourth power. That gap between the two numbers is the variability index.
Conclusion
The first thing to do is simple: log your next few rides and write down average power, normalized power, duration and how the ride felt. After a handful of sessions the pattern tells you more than any single number ever will, because normalized power only makes sense next to variability and time.
Use it to compare a hilly Saturday against a Tuesday threshold session, to catch the rides that quietly cost you more than their average suggested, and to spot a day that was harder to hold than usual. Then watch the trend over months rather than chasing one value. If you have questions about any of the figures on this page, the rest of our training and ride-report coverage picks up where this leaves off.