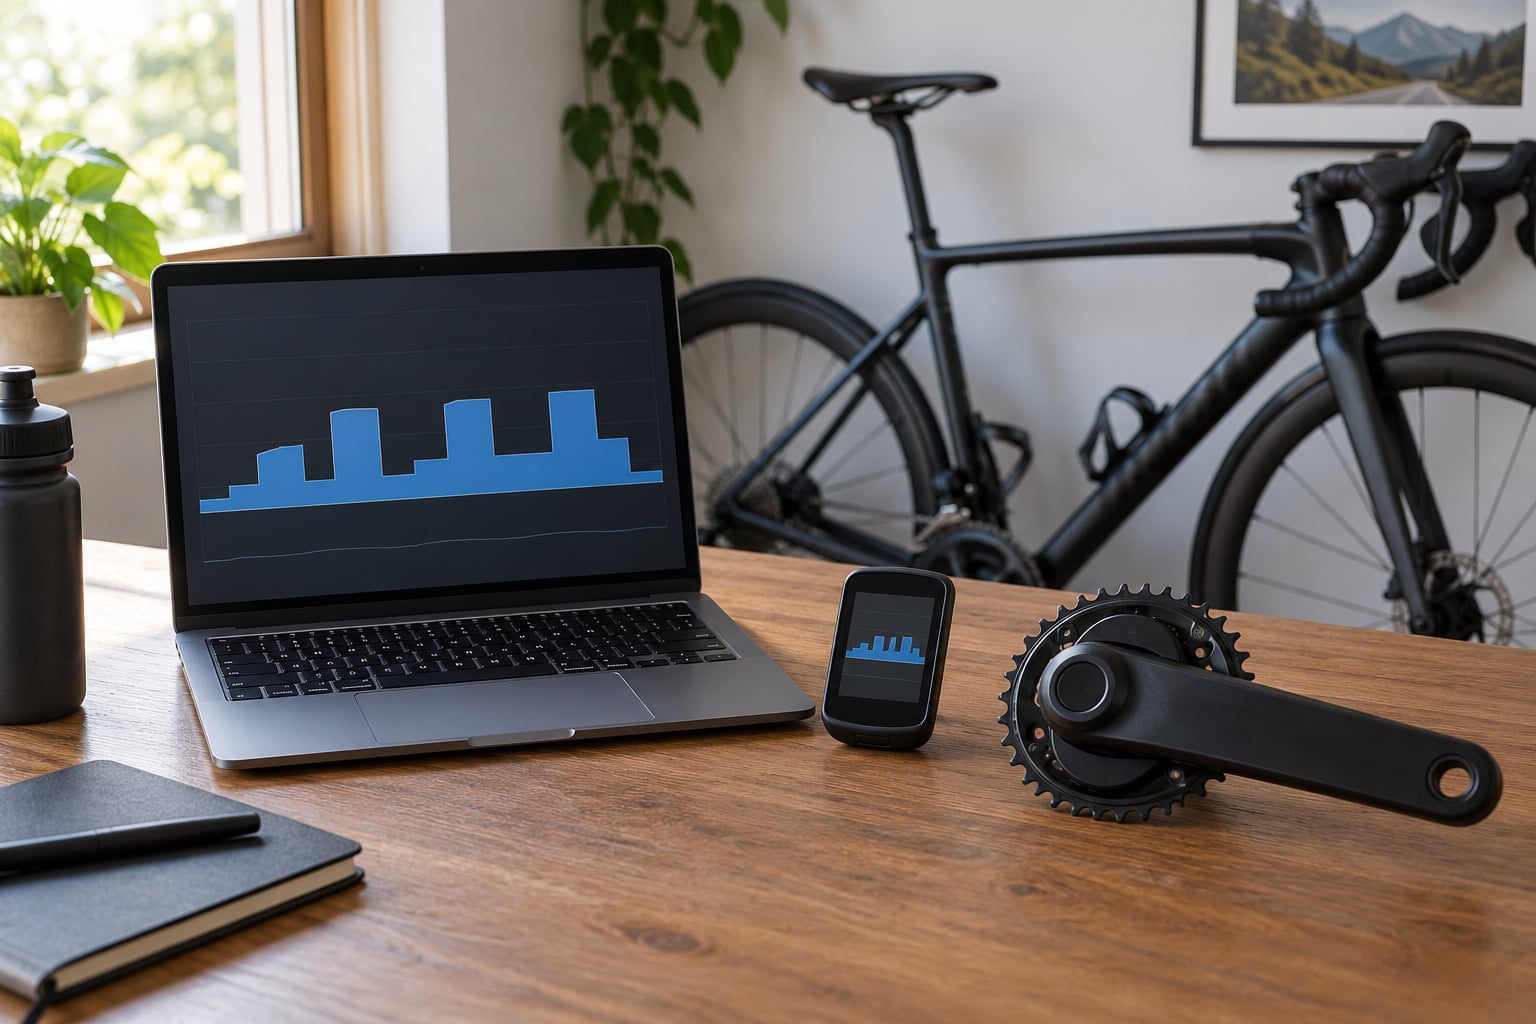
Intensity Factor (IF) is your Normalized Power divided by your Functional Threshold Power, written out as IF = NP / FTP. It tells you how hard a ride was compared with your own one-hour maximum, as a plain decimal. A rider whose normalized power was 216W against an FTP of 240W recorded an IF of 0.90.
That is the whole definition, and it is genuinely all there is to it. If you have had intensity factor explained for cyclists before and it sounded like a formula designed to make your ego uncomfortable, here is the useful part: what the number says, what it hides, and how to read one without arguing with yourself for an hour afterwards.
Table of Contents
- What Is Intensity Factor? The Full Definition for Cyclists
- How Is Intensity Factor Calculated? Step by Step
- Stage one: building Normalized Power
- Intensity Factor explained: a worked example
- Where FTP comes from
- Typical intensity factor ranges by ride type
- Why Cyclists Use Intensity Factor (And What It Hides)
- How Do You Use Intensity Factor in Training?
- Read IF next to duration
- Spot a stale FTP
- Bridging IF and your training zones
- Finding IF on your device
- Intensity Factor Explained with a Century Ride Example
- What Is the Difference Between Intensity Factor and TSS?
- What IF is good for, and what it is not
- Frequently Asked Questions
- What is a good intensity factor for cycling?
- What does an intensity factor of 1.0 mean?
- Is intensity factor the same as TSS?
- Why is my intensity factor different between apps?
- Can you compare my intensity factor with another cyclist’s?
- Does intensity factor include the warm-up?
- Conclusion: Start With the Number, Then Use the Context
What Is Intensity Factor? The Full Definition for Cyclists
Intensity Factor is the ratio of a ride’s Normalized Power to your Functional Threshold Power, expressed as a decimal. Normalized Power is a power-averaged figure that punishes surges. FTP is the highest average power you can hold for one hour. Divide one by the other and you have the intensity of that ride as a fraction of your threshold.
Two things follow immediately. Because your own FTP is in the bottom of the equation, the number is self-normalising: a rider with a 260W FTP and a rider with a 190W FTP can both sit at 0.80 on the same kind of ride, and both are working correctly. And because it carries no units at all, it cannot be compared between riders. A higher number describes a harder ride, not a better cyclist.
The idea came from Dr Andrew Coggan and Hunter Allen, whose power-based training work in the early 2000s produced the Normalized Power, IF and Training Stress Score formulas that most platforms still run today. TrainingPeaks later registered Intensity Factor as a trademark, which is the tidy explanation for the naming differences you see between apps.
If you are new to power meters, this is genuinely a metric you can skip for now. Get a reliable FTP and comfortable zone boundaries first; IF, Variability Index and TSS are all downstream of those two things.
How Is Intensity Factor Calculated? Step by Step
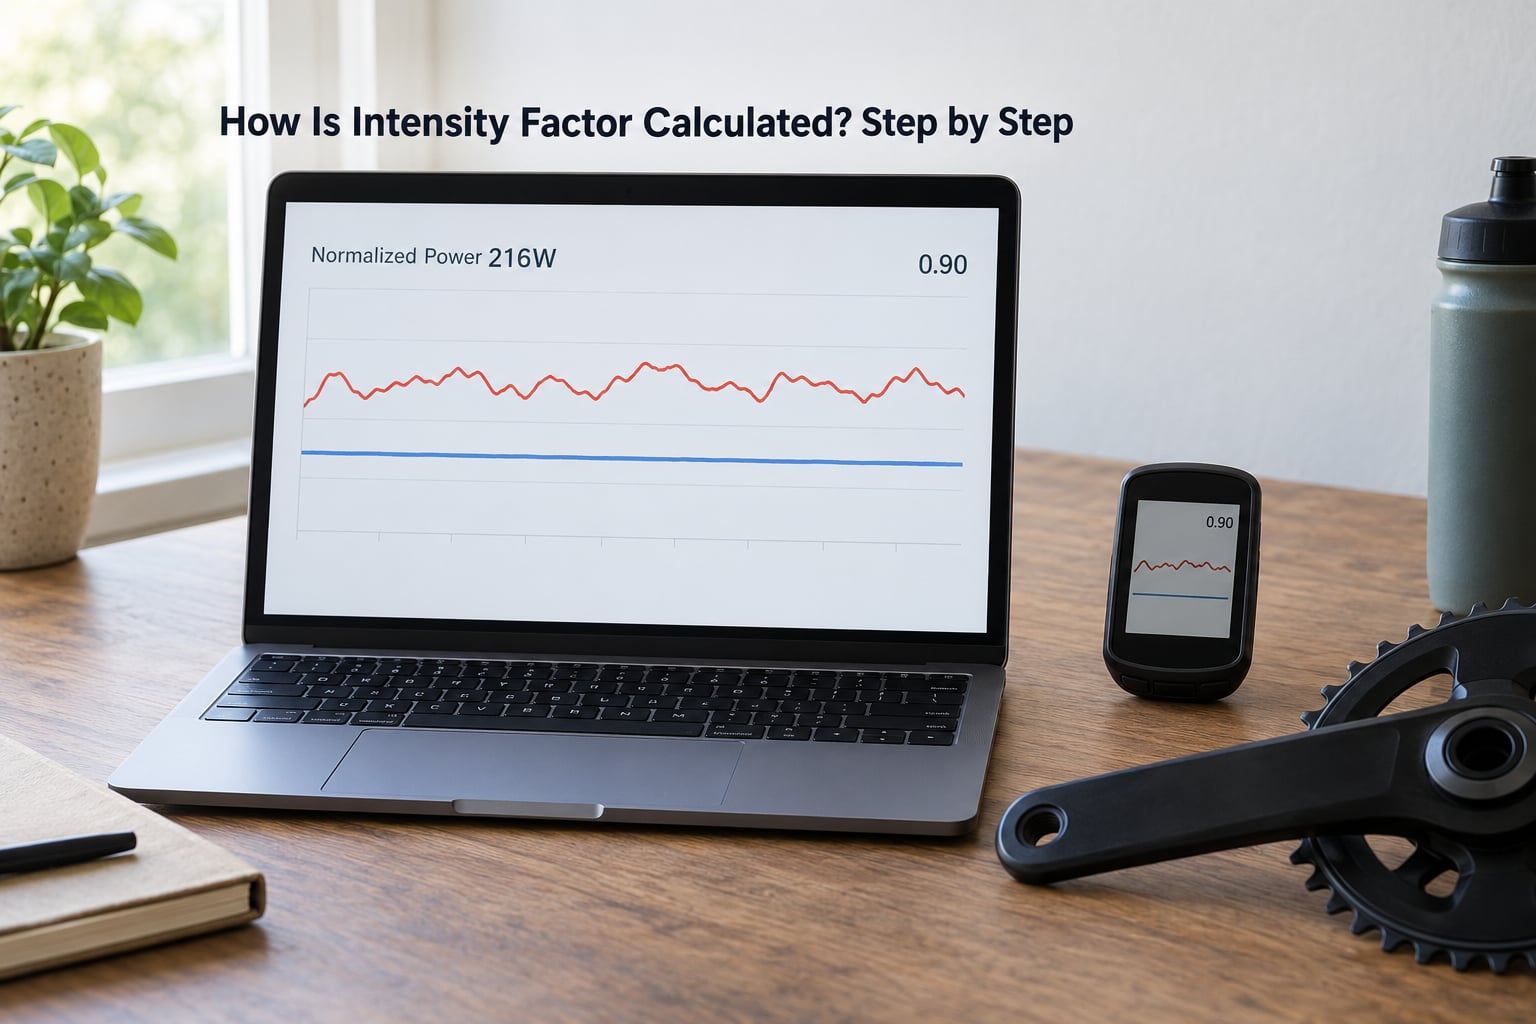
Your head unit or app does the maths in two stages. Stage one builds Normalized Power from your power trace. Stage two divides that by FTP.
Stage one: building Normalized Power
- Take a 30-second rolling average of your power, point by point, so a single one-second spike cannot dominate.
- Raise each of those averaged values to the fourth power.
- Average the whole set of raised values.
- Take the fourth root of that average.
The fourth power is the part that confuses people, and it comes straight from physiology. Coggan’s paper on trained cyclists found that lactate production rises roughly with the fourth power of watts, so the maths is a rough mirror of what your body does. Raise a number to the fourth and small values shrink while large ones explode, which is exactly how hard efforts feel.
Here is the effect in one comparison. A ride of 10 minutes at 145W, 20 minutes at 265W and 30 minutes at 175W produces an average power of 200W. Normalized Power for that same ride is 216W. Nobody worked that hard for most of an hour, but the two hard blocks dominate the number anyway.
Intensity Factor explained: a worked example
With Normalized Power at 216W and an FTP of 240W, IF = 216 / 240 = 0.90. Round to two decimals and you have your ride’s intensity factor. The same ride against a 270W FTP would read 0.80, which is the self-normalising behaviour in action.
Where FTP comes from
FTP is a field estimate, not a laboratory number. Most riders use the classic 20-minute test: hold the hardest sustainable effort for 20 minutes, take the average, then take off roughly five percent. That gives a value that behaves well enough for planning, and it only needs to be roughly right. A five percent error in FTP moves your IF by about five percent, which is a rounding error compared with the effect of a bad day.
Typical intensity factor ranges by ride type
| Ride or session | Typical IF | What it usually feels like |
|---|---|---|
| Recovery spin | Below 0.70 | Easy enough to hold a conversation |
| Long endurance ride | 0.70 to 0.85 | Steady, sustainable all day |
| Group ride with surges | 0.75 to 0.88 | Comfortable spin punctuated by accelerations |
| Tempo ride | 0.85 to 0.95 | Comfortably hard, controlled breathing |
| Threshold intervals | 0.95 to 1.05 | Holding a hard, limited-duration effort |
| VO2 max repeats | 1.00 to 1.10 | Very hard, short, recovering between efforts |
| Race | 0.90 to 1.15+ | Varies wildly by discipline and terrain |
| Commute with traffic | 0.60 to 0.80 | Dragged down by stops, coasting and junctions |
These are reference ranges, not rules to hit. Weather, terrain, group behaviour and how fresh you are will all move the number, and chasing a specific decimal is how people end up riding badly to satisfy a screen.
Why Cyclists Use Intensity Factor (And What It Hides)
The value of IF is comparison. Once everything is divided by your FTP, a two-hour hilly gravel ride and a two-hour flat spin land on the same scale, and you can see which one actually cost you more. That is the single thing average power cannot do on its own.
It also rewards patience in an odd way. A ride with two long surges can carry a higher IF than a steady one, because Normalized Power weights the surges heavily. On a stop-start urban commute, however, the opposite happens: every stop and restart fragments the ride, the rolling average treats each restart as a fresh burst, and the IF gets dragged down even though the effort felt hard. Riders routinely read that as poor fitness when the real cause is traffic lights.
Coasters are a similar trap. On a long descent the head unit frequently records zero watts, and a block of zero-power data lowers the average, which lowers normalized power, which lowers the IF. The same descent on another bike, with a slightly different crank or a different power-meter timeout setting, can produce a visibly different number for an identical ride.
What IF hides matters just as much. It says nothing about how you felt, nothing about heart rate drift, and nothing about whether the power numbers themselves were clean. A ride with a torn cable or a miscalibrated meter can be wrong at the source. On a hot day with a rising heart rate, the same IF represents a much bigger physiological strain than the identical IF in spring.
Because IF is a ratio of two numbers, one of which you typed in yourself, it can only ever describe the ride against the FTP you claimed. When riders argue online about whether a 0.92 on a hilly two-and-a-half-hour group ride is normal, they are usually arguing about their FTP numbers, not about the maths.
How Do You Use Intensity Factor in Training?
Use it as a descriptor, not a target. Open a ride after the fact, read the IF, and ask whether the effort matched the intention. That is the whole job, and it works because the number is honest about variability.
Read IF next to duration
Intensity alone tells you almost nothing about cost. Two rides at 0.90 for one hour and four hours are not the same week of training. This is why experienced coaches push back on IF as a standalone metric: what matters is the number, the length and the placement of the work, not an average of it.
The practical habit is worth building. If your weekly average IF climbs while your hours stay flat, you are drifting into a race-every-week pattern that most riders cannot absorb. If your hours climb and the average IF falls, that is usually the correct trade, not a loss of form.
Spot a stale FTP
This is the most useful thing IF does, and almost nobody uses it. If your FTP was set a year ago and you have been training since, your real threshold has probably moved. An IF that looks too good for the duration is the giveaway.
A sensible rule of thumb is to treat an IF above roughly 1.05 on a one-hour race or test as a prompt to retest. The reason is simple arithmetic: because stress scales with IF squared, a number that should have been a 0.95 can quietly become a 1.15 and your load numbers follow it straight up.
Bridging IF and your training zones
Riders know zone 2 as a percentage of FTP and then meet IF as a decimal, with no bridge between the two scales. Here is one, using the Coggan seven-zone model that Garmin, Wahoo and TrainingPeaks all draw from.
| IF | Share of FTP | Coggan zone | Duration it suits |
|---|---|---|---|
| Below 0.55 | Under 55% | Active recovery | Minutes |
| 0.55 to 0.75 | 55% to 75% | Endurance | Hours |
| 0.76 to 0.85 | 76% to 85% | Tempo | 30 to 90 minutes |
| 0.86 to 0.91 | 86% to 91% | Threshold | 10 to 30 minutes |
| 0.92 to 1.00 | 92% to 100% | VO2 max | 3 to 8 minutes |
| 1.00 and above | Over 100% | Anaerobic | Under a minute to a few |
Read across and you can see why a long endurance ride never carries a high IF. Two hours of zone 2 works out around 0.70 to 0.78, which looks modest on screen while being one of the most valuable things you do all week.
Finding IF on your device
- Garmin — open the activity in Garmin Connect or the Connect IQ data pages, where Intensity Factor sits alongside Training Stress Score in the activity summary.
- Wahoo — the ELEMNT and Bolt units show IF on the ride summary screen and sync it to the Wahoo Fitness app.
- Strava — on a cycling activity, expand the analysis section and look for the Intensity Factor entry beside Relative Effort. Strava’s figure is its own estimate and will not always match other apps.
- TrainingPeaks — the daily or weekly view shows intensity factor per ride, and lets you prescribe a target IF for a workout.
- Zwift — the post-ride results screen displays your IF alongside the rating and estimated FTP.
- TrainerRoad — each workout ends with IF and TSS, and the platform uses IF to rate how hard a session was relative to your current FTP.
Different platforms can report different values for the same file because smoothing rules, power-dropout handling and FTP defaults differ. TrainingPeaks registered the Intensity Factor trademark, and other platforms use variants of the same idea with their own settings. If two apps disagree by a hundredth or two, that is normal; a large gap usually means different FTP values.
Intensity Factor Explained with a Century Ride Example
The clearest way to see what IF does is to line up three two-hour-plus rides and look at the same four numbers. Assume an FTP of 240W throughout.
| Ride | Duration | Average power | Normalized power | IF | TSS |
|---|---|---|---|---|---|
| Flat group ride at an easy chat pace | 2h 30m | 150W | 162W | 0.68 | 84 |
| Steady tempo spin on the flat | 2h 30m | 216W | 219W | 0.91 | 249 |
| Hilly century with fast descents | 3h 10m | 186W | 214W | 0.89 | 234 |
Two findings jump out. First, the hilly century produced an IF almost identical to the steady tempo spin despite a much lower average power, because the climbs were hard and the average was dragged around by the descents. Second, the easy group ride scored about a third of the training load despite being only minutes shorter, which is the honest answer to “should I replace long easy rides with short hard ones”. You are not trading like for like.
This is also the breakdown of the “high IF means a good ride” myth. My own rule after years of looking at these numbers is simple: the ride with the higher IF is the harder ride, and the ride with the higher TSS is the more expensive one. They are frequently not the same ride.
What Is the Difference Between Intensity Factor and TSS?
Intensity Factor classifies a ride. Training Stress Score measures its cost. IF has no units and no duration; TSS has both.
The relationship is a clean formula: TSS = (IF × hours) × 100, for a session of roughly an hour or longer. Double the intensity for the same hour and the stress quadruples, because the IF is squared inside the calculation. That is why an IF of 1.10 for 30 minutes can produce a bigger TSS than an IF of 0.70 for two hours.
Two supporting numbers sit alongside them. Variability Index is NP divided by average power: above 1.0 means your power was variable, below 1.0 means it was steadier than your average. A hilly century typically lands well above 1.1. And a Fitness Fatigue Chart built from CTL, ATL and TSB is where IF and TSS finally get used for planning, because those curves describe fitness and fatigue over weeks, which no single ride can show.
One more piece of vocabulary worth knowing, since it shows up on the same screens. Keeping most of your weekly time below 75 percent of FTP is the traditional endurance ceiling. A three-hour easy ride at roughly 0.70 to 0.75 IF respects it; a two-hour ride at 0.95 does not, however much you enjoyed it.
What IF is good for, and what it is not
It is good for comparing rides on one scale, checking whether a session matched its intent, spotting a stale FTP, and giving you a single honest number to discuss with a coach or a training partner.
It is not a fitness score, not a ranking, not a mood, and not something to compare with the rider next to you. The criticism heard on cycling forums, that these numbers inflate fragile egos, has a fair kernel: without duration and context, IF on its own is close to meaningless. Used as a retrospective description of a ride you just finished, it is a genuinely useful piece of information.
Frequently Asked Questions
What is a good intensity factor for cycling?
A good intensity factor depends entirely on the ride and your FTP. Recovery rides sit below 0.70, endurance riding between 0.70 and 0.85, tempo between 0.85 and 0.95, and threshold or racing efforts above that. Because IF is a fraction of your own FTP, there is no universal good number and nothing to compare against other riders.
What does an intensity factor of 1.0 mean?
An intensity factor of 1.0 means your normalized power equalled your FTP, so the ride worked out to roughly your one-hour maximum averaged across the whole session. Sustaining an IF of 1.0 for a full hour is exceptionally hard. If that number shows up on an easy-looking ride, your FTP setting is probably too low.
Is intensity factor the same as TSS?
No. Intensity Factor is an intensity classification with no units and no duration, calculated as normalized power divided by FTP. Training Stress Score combines intensity and time using TSS = (IF x hours) x 100. A short very hard ride and a long moderate ride can share an IF while producing very different TSS values.
Why is my intensity factor different between apps?
Each platform chooses its own smoothing and power-dropout rules, and some use a default FTP rather than yours, so the same ride file can produce slightly different results. TrainingPeaks registered Intensity Factor as a trademark and other apps use variants of the formula. A difference of a hundredth or two is normal; a large gap usually means different FTP values.
Can you compare my intensity factor with another cyclist’s?
No, and any rider who does is chasing the wrong thing. IF is dimensionless and self-normalising, so it is normalised against each person’s own FTP. Two riders can post an identical 0.90 while one is a strong club racer and the other a novice. Compare your rides to your own history instead.
Does intensity factor include the warm-up?
It does, and a slow warm-up pulls the final number down. Because normalized power averages the entire recording, every minute at easy power lowers the value, so a 20-minute warm-up at 120W in front of an hour at 220W produces a lower IF than the hard hour deserves. Raising power meter and head unit recording options can help.
Conclusion: Start With the Number, Then Use the Context
Open your most recent ride, find the intensity factor, and compare it with what you actually intended to do. That single check is where intensity factor explained for cyclists pays off: one number, your own scale, no opinion required.
Then pair it with duration before you draw any conclusion, and never with another rider’s. Updated for 2026, the formula has not changed and neither has the rule that matters most.