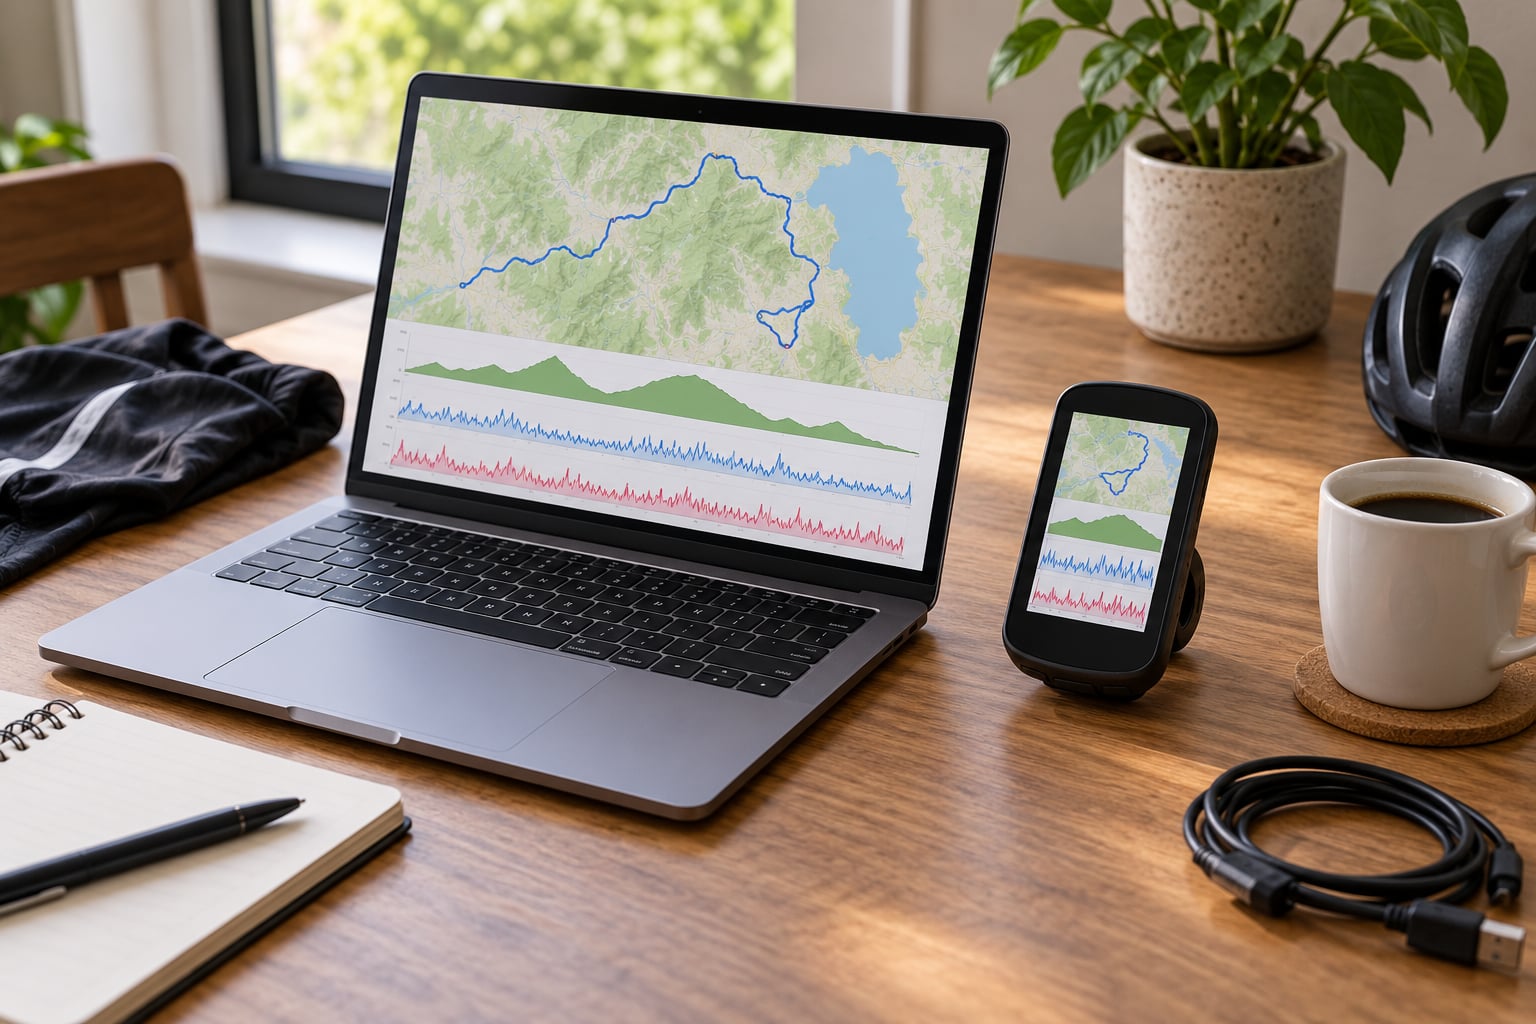
To analyze a ride file, export the recording from your head unit or platform, open it in an analysis tool, confirm the activity details, then read the summary metrics before the graphs. The whole job takes about ten minutes once you know what each channel is telling you.
Most riders open a ride, scroll past twenty-odd numbers, and feel worse than when they started. That happens because the file is a recording of effort, not a verdict on effort. The data cannot know whether you were tired, whether the wind was against you, or whether your chain needed oil.
This guide walks through a repeatable workflow that ends in a decision rather than in staring. It also covers the bad-data traps that quietly corrupt a ride summary, and what to check when you have no power meter at all.
Table of Contents
- What You Need
- How to Analyze a Ride File Step by Step
- 1. Confirm the File and Ride Context
- 2. Read the Ride Summary Before the Graphs
- 3. Check Power and Heart Rate Together
- 4. Inspect Elevation, Gradient, and Pace
- 5. Look for Trends Across Repeated Rides
- 6. Validate Data Quality and Export a Useful Record
- How to Analyze a Ride File With No Power Meter
- Common Mistakes
- Frequently Asked Questions
- Should I analyze a FIT file or a GPX file?
- Which tool should I use to analyze a ride file?
- Does it matter if a ride file has no heart rate or power?
- How do I compare two rides on the same route?
- How often should a cyclist review old ride files?
- Conclusion: Start With the Ride Summary
What You Need
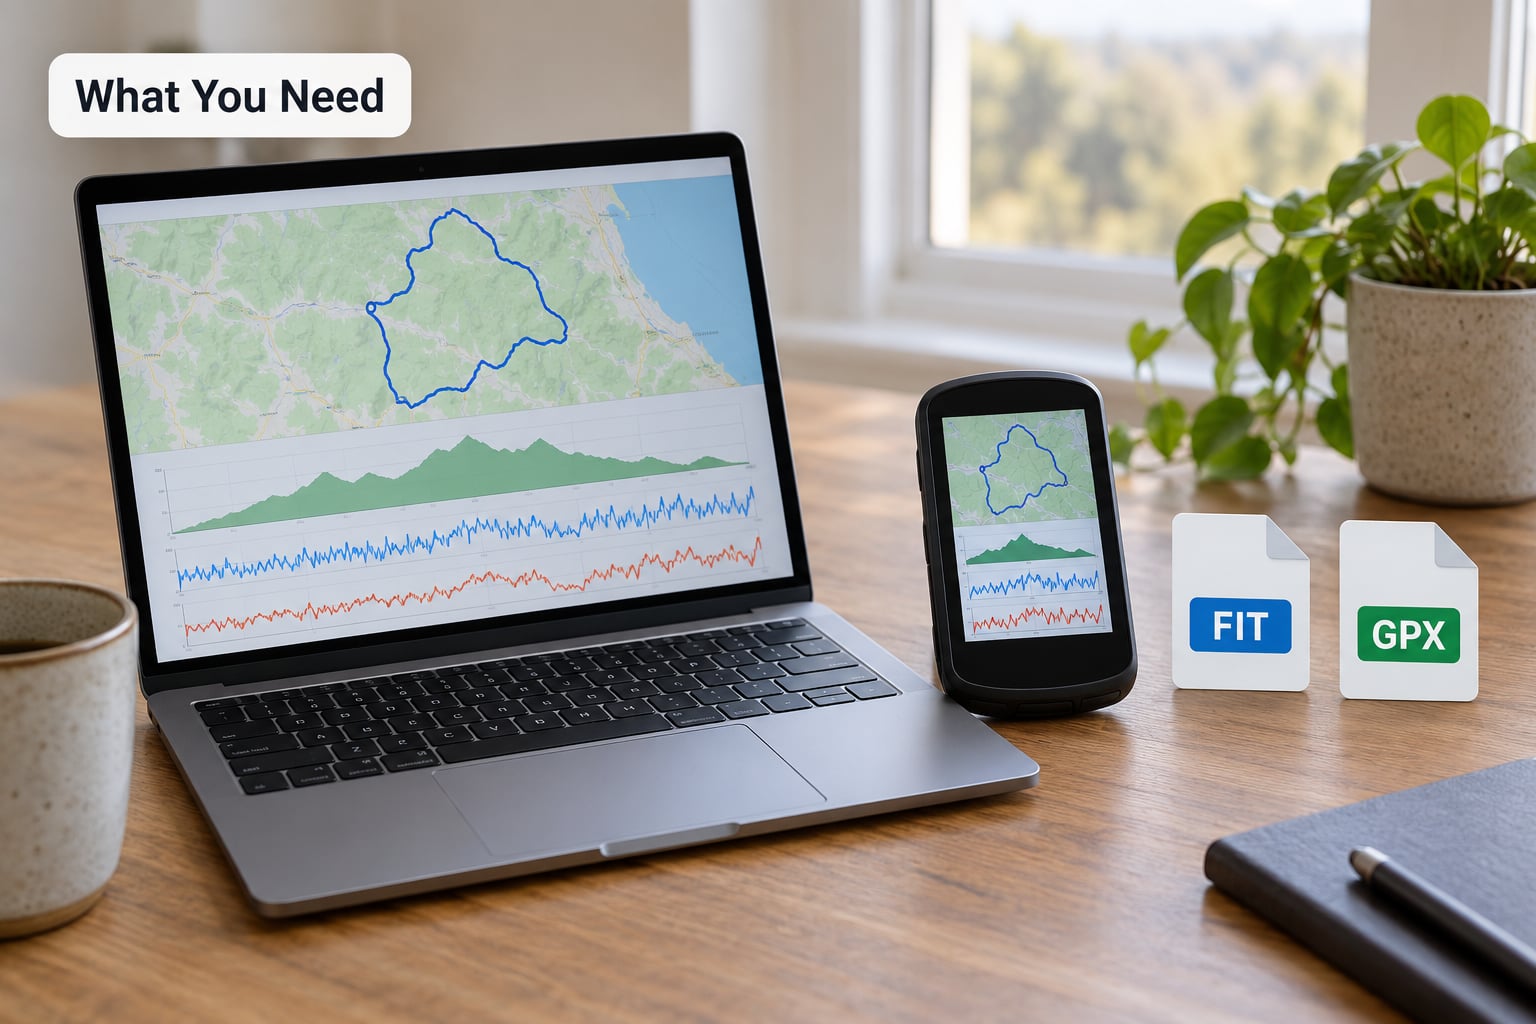
You need three things: the file itself, somewhere to open it, and a note of what the ride was supposed to be. That last one matters more than people expect.
A ride file is the digital record your device writes at the end of every ride. Most head units write a .FIT file, which is the native Garmin format and the richest option because it keeps sensor channels and interval structure intact. TCX is the older Garmin XML format, still common in exported archives. GPX holds the route, elevation and track points but often drops power and heart rate channels.
For tools, a sync platform such as Strava, Garmin Connect or Ride with GPS gives you a ride page with the basics in seconds. A dedicated desktop analyzer such as GoldenCheetah gives you every channel, custom views and raw file export. A one-off web uploader is useful when you just want FTP and zone numbers from a test file without installing anything.
Write down the context before you open anything: rider, route, duration, device, weather, and the purpose of the ride. Was it meant to be an easy spin, a threshold session, or a long ride with a coffee stop? A file cannot tell you the intent, and intent is the only thing the numbers get judged against.
How to Analyze a Ride File Step by Step
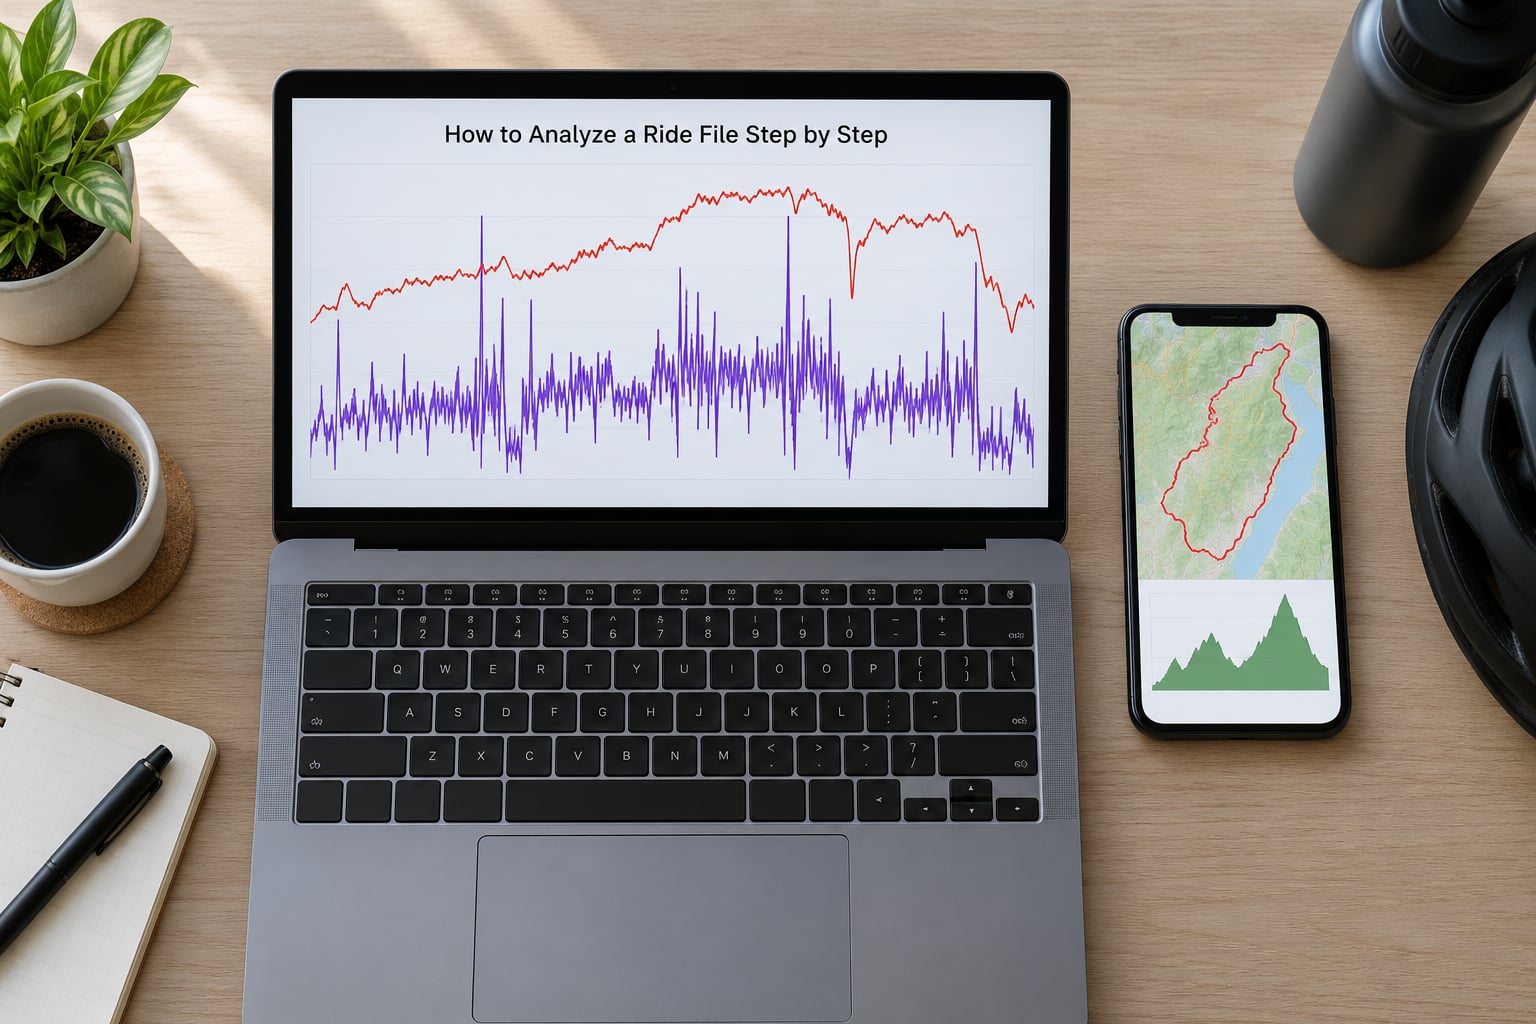
1. Confirm the File and Ride Context
Open the file and check the header first: date, start time, sport type, device, and total recording time. A mis-set device clock scatters every timestamp, which then breaks interval detection and can split one ride into two.
Confirm the recording time matches the actual ride. If a two-hour ride shows fifty minutes, the recorder stopped early or the file was truncated during a transfer. If it shows two hours and thirty, something kept recording after you stopped.
You know the file is ready when the duration, distance and channel list all line up with what you remember. That check takes thirty seconds and saves you from analyzing a broken file for twenty minutes.
2. Read the Ride Summary Before the Graphs
Start with duration, distance, elevation gain, average and maximum speed, work done in kilojoules, and average heart rate. These give the shape of the ride without any interpretation.
Context comes from the comparison, not the single number. An intensity factor of 0.75 means very different things on a flat two-hour spin and on a hilly century. A rider with functional threshold power of 210 watts and one with 320 will produce the same file-level numbers on completely different rides.
If a value looks wrong, go straight to the cause rather than to the number. High elevation gain on a flat route usually means a barometric or GPS spike. Implausible maximum speed usually means a bad sample. Zero kilojoules on a moving ride means the power channel failed. Unexpectedly low average speed often means pauses got recorded as riding.
3. Check Power and Heart Rate Together
Read power and heart rate as a pair, never alone. The useful sequence is: average power, normalized power, intensity factor, variability index, and time in zone, with heart rate sitting beside each one.
Normalized power applies a 30-second rolling average and weights effort by the fourth power, so short hard efforts count more than long easy ones. It estimates the equivalent steady effort a ride would have produced. Average power is the plain arithmetic mean and is the number most often misread, because a ride with one sprint looks almost identical to a steady one.
Variability index is normalized power divided by average power. Below 1.05 means remarkably steady, which is what you want for a long steady ride or a time trial. Above 1.20 means the effort was scattered: intervals, surges, a traffic stop, or a fight with the headwind.
| Metric | What it measures | Formula | Healthy range | Action |
|---|---|---|---|---|
| Average power | Total work spread evenly over time | Work divided by riding time | No single target | Use for total-effort context only |
| Normalized power | Equivalent steady effort | 30-second rolling average, raised to the fourth power, averaged, then root taken | Varies by ride | Compare like rides against like rides |
| Intensity factor | How hard, relative to you | Normalized power divided by threshold power | 0.65 to 0.78 for endurance rides | Above 0.85 on a social ride means the ride was hard |
| Variability index | Pacing steadiness | Normalized power divided by average power | Under 1.08 | High values point to surges or stops |
| Aerobic decoupling | Whether fitness held up | First-half versus second-half power-to-heart-rate ratio | Under 5% | Above 10% on an easy ride means the day was short on recovery |
| Training stress score | One number for load | Duration times intensity factor times 100 divided by threshold power factor | Daily load under 150 on easy days | Use to balance hard and easy days |
Heart rate adds the reason behind the watts. Power climbing while heart rate stays flat means heat, adrenaline or a tailwind. Heart rate climbing at steady power means heat, fatigue, dehydration or a hard effort. A decoupled ride, where heart rate drifts upward for the same output, is the clearest self-training signal most riders never look at.
Cadence catches mechanical problems. Cramming at low cadence on climbs, or grinding at very high torque on the flat, shows up as a sharp correlation between low cadence and high variability in power. If power spikes while speed does not, suspect a drivetrain issue rather than a good effort.
4. Inspect Elevation, Gradient, and Pace
Look at the elevation profile before the power trace. Note total gain, the steepest sustained gradient, and where climbs sat in the ride. Then compare pace against gradient segment by segment.
A genuine pacing response changes with terrain in a way a mechanical fault does not. Power drops on a climb while heart rate rises, then both settle on the descent. If instead you see high power at near-zero speed on a flat section, something is wrong with the drivetrain, the tyre pressure or the power meter calibration.
Distinguish signal from noise. A sudden 40 km/h spike on a climb, or a sudden drop to zero watts on a descent, is nearly always a GPS or sensor dropout. Watch for the same thing on a bridge in a forest, under tree cover, or where two devices swap channels.
Descent data deserves a check too. A descent with high power and low speed usually means headroom and heavy pedalling, which is fine. A descent with an unusually low top speed compared with your usual route points to a bent wheel, a pressure problem or a strong tailwind.
5. Look for Trends Across Repeated Rides
One ride is a sample. Two rides on the same route are a trend. Open three or four rides covering the same loop, the same climb, or the same session format, and compare like with like.
Look at repeatable changes: the same climb segment getting faster at the same heart rate, an interval session that used to sit at 95 percent of target and now sits at 90, an endurance ride whose heart rate drifts more each month. Those are the signals worth acting on.
Then control for what you can. Weather, altitude, sleep, hydration, tyre pressure and equipment changes all move the numbers. Record the variables you know about so a strange Tuesday does not become a training decision.
For structured sessions, verify the work interval by interval. Auto-detected intervals on an outdoor ride are often wrong, so match each rep against the target by time. That is exactly the check riders on training forums use to confirm a threshold session actually hit power.
6. Validate Data Quality and Export a Useful Record
Before drawing any conclusion, hunt for bad channels. Look for dropped samples, power spikes above what a human can produce, sudden zeroes, heart rate flatlines at exactly the same value for minutes, missing elevation, and cadence dropouts to zero.
Fix what the tool allows: zero out obvious dropouts, correct the wheel size in device settings, re-pair the heart rate strap, and check that the power meter battery is holding a stable connection. When a file is unrecoverable, annotate it as unusable rather than quietly averaging it into your history.
Estimated power deserves a label. Some platforms generate power from speed, rider weight, and device models when no meter is present. It is a reasonable guide for casual rides and a poor basis for setting zones or comparing intervals. Mark any file that uses estimated power so you never compare it against measured data by accident.
Finish by exporting or writing a short ride note: what the ride was for, what the file says happened, and what you will change. Three lines is enough. Save it in the same place every time, because a note you can find six weeks later is the entire point.
How to Analyze a Ride File With No Power Meter
Without a power meter you still have heart rate, cadence, speed, elevation and time. Use heart rate as the primary channel with a time-in-zone histogram, then check drift within the ride by comparing your heart rate at the same power-free effort in the first and second halves.
Keep zone settings honest and re-test them regularly, because a bad threshold anchor makes every other number misleading. Riders report on forums that testing twice in one week usually produces a better second result, which is a cheap fix for a shaky number.
Treat estimated power as a trend indicator only. Fine for noticing that this ride felt heavier than last month’s, useless for deciding whether an interval session hit target.
Common Mistakes
Chasing average power. It is the least useful headline number in the file. Look at normalized power and intensity factor instead, and use average power only to describe the ride’s overall character.
Treating one metric as the explanation. A single number never explains a ride. Power without heart rate misses heat and fatigue; heart rate without power misses pacing; speed without gradient misses what the road asked of you.
Confusing normalized power with everyday effort. Normalized power is a comparison tool. Judging a three-hour endurance ride by how its normalized power felt will convince you every easy day was too hard.
Ignoring device and sampling problems. A wrong wheel size inflates speed and distance. Zero-power coasting drags average power down. Check one older file against your own memory before you trust a whole season of them.
Comparing unlike rides. Position changes recorded output, which riders on cycling forums notice regularly: the same rider produces lower watts in a tucked aero position than upright, so zones set from upright riding will look generous when you switch to a time-trial bike.
Mixing indoor and outdoor files. Virtual rides and trainer sessions include no wind, no heat and no cornering load. Keep them in a separate bucket so they do not distort outdoor trends or weekly load charts.
Analyzing everything. A workable rhythm is a sixty-second check after the ride, five minutes once a week, and fifteen minutes once a month. Anything more tends to produce anxiety rather than fitness, and the file will still be there tomorrow.
Frequently Asked Questions
Should I analyze a FIT file or a GPX file?
Analyze the FIT file when you have one. It is the native format and keeps power, heart rate, cadence and interval structure intact, so charts and zone times render properly. GPX is better for the route, elevation and track points, and often drops sensor channels entirely. If your platform only exports GPX, the summary numbers will still work, but expect missing power detail on older devices.
Which tool should I use to analyze a ride file?
Use a sync platform for a fast post-ride glance, since it shows normalized power, intensity factor and time in zone within seconds of syncing. Use a desktop analyzer when you want every channel, custom charts and raw file export. Use a browser-based uploader when you just need FTP and zones from a test file. Free options cover all three cases for most riders.
Does it matter if a ride file has no heart rate or power?
It limits the analysis, not the value of it. Without power you lose normalized power, intensity factor and variability index, so base your review on heart rate drift, cadence and speed against gradient. Without heart rate you lose decoupling and any heat or fatigue signal. Many head units also fill in estimated power from speed and rider weight, which is fine for trends but not for setting zones.
How do I compare two rides on the same route?
Pick rides done in similar conditions and match them on duration, terrain and purpose. Compare normalized power and heart rate at the same points on the route, or use a segment leaderboard for climbs and sprints. A second-half versus first-half split is the simplest test: if the same effort produced more heart rate the second time, fitness or recovery changed, not the route.
How often should a cyclist review old ride files?
Do a sixty-second check right after the ride, a five-minute review of the week’s highlights once a week, and a fifteen-minute trend check once a month. Revisit older files only when you are changing something, such as re-testing your threshold or switching equipment. Note that menu paths and platform screens change often, so verify steps against your current version.
Conclusion: Start With the Ride Summary
Start by confirming the file and the ride context, then read the summary numbers before you touch a single graph. Those two steps take a couple of minutes and rule out most broken files before they waste your evening.
From there, work outward: power and heart rate together, then elevation and pace, then trends across similar rides, then a data quality check. End with one written line about what to change. The file is a record of what happened, and the note is the part that makes the next ride better.